
THE 100 MOST OVERPAID CEOs
Are Fund Managers Asleep at the Wheel?
In 2015, As You Sow embarked on a mission to identify and report on the most overpaid CEOs of the S&P 500 and whether or not pension funds and financial managers held companies accountable for such excessive compensation. At the time, we found that far too many funds and managers were rubber stamps for these excesses.
This 2019 study is the fifth report of our research results. During these five years, what has changed? Quite a bit, and not enough. Significantly, more large shareholders are voting against more CEO pay packages. Those who are not are more isolated and defensive.
Companies have responded to this shareholder opposition. A February 2019 Equilar analysis, Companies Shift CEO Pay Mix Following Multiple Say on Pay Failures, found that “The average CEO total compensation at companies that failed Say on Pay (shareholder votes) decreased significantly from 2011 to 2017, a total of 44.9% over that time frame.”1
Yet overall CEO pay continues to increase. According to Institutional Shareholder Services (ISS) the average pay for a CEO in the S&P 500 grew from $11.5 million in 2013 to $13.6 million in 2017. An analysis by the Economic Policy Institute, which includes the cashing in of stock options, found that “in 2017 the average CEO of the 350 largest firms in the U.S. received $18.9 million in compensation, a 17.6 percent increase over 2016.”2
The Tax Cuts and Jobs Act, which became effective in 2018, has been called a giveaway to corporations, which used their huge tax savings to buy back their own stock instead of creating more jobs or raising worker pay ($4,000 a year was promised), as supporters claimed would happen. However, the law produced a positive change with respect to executive compensation. It eliminated the loophole for executive “performance-based pay” in section 162m of the tax code that was used to get around the $1 million cap on the amount of executive compensation that corporations could deduct from their taxes. Many experts believe this “performance pay” loophole from 1990s tax legislation was a factor in the spiraling increase of CEO pay that followed.


Thanks to the 2010 Dodd-Frank financial reform bill, shareholders gained access to new information this year. Companies must now disclose the ratio of pay between the CEO and the company’s median employee, shining a brighter light on how high CEO pay has become. This new information can also be used in other ways. As discussed in the pay ratio section of this report, the city of Portland, Oregon was the first to introduce a corporation tax rate based on this ratio.
This change happened amidst growing acceptance that there are financial reasons to be concerned about economic inequality. In October 2018, the UN Principles for Responsible Investment (UN PRI) published a critical report, “Why and how investors can respond to income inequality.” In the foreword, UN PRI CEO Fiona Reynolds writes: “Institutional investors have increasingly begun to realize that inequality has the potential to negatively impact institutional investors’ portfolios, increase financial and social system level instability; lower output and slow economic growth; and contribute to the rise of nationalistic populism and tendencies toward isolationism and protectionism.”3
As Bloomberg columnist Nir Kaissar noted in a recent editorial, “As the grim pay disclosures pile up year after year, the backlash against the corporate elite will intensify. If corporate boards can’t find a better balance in their pay structure, outside forces will, and at a potentially far greater cost to companies and their shareholders.” Bloomberg’s Alicia Ritcey and Jenn Zhao compiled the CEO-to-worker compensation ratios for companies in the Russell 1000 Index and found that “the median employee compensation for 104 of the companies is below the federal poverty level of $25,750 for a family of four. That’s the number below which workers are eligible for government assistance.”4
Opposition to high CEO pay has risen, and more companies have seen their CEO pay packages receive less and less support from their shareholders. European funds and U.S. public pension funds have made their opposition to a broken system clear. In this year’s report we pay special attention to those funds with the greatest change in voting practices on the issue of CEO pay as well as highlight some of the reasons that have led to more shareholder votes against those pay packages.
HIP Investor regression we’ve used every year that computes excess CEO pay assuming such pay is related to total shareholder return (TSR). The second ranking identified the companies where the most shares were voted against the CEO pay package. These two rankings were weighted 2:1, with the regression analysis being the majority. We then excluded those CEOs whose total disclosed compensation (TDC) was in the lowest third of all the S&P 500 CEO pay packages. The full list of the 100 most overpaid CEOs using this methodology is found in Appendix A. The regression analysis of predicted and excess pay performed by HIP Investor is found in Appendix C, and its methodology is more fully explained there.
Figure 1 (below) lists the 25 most overpaid CEOs, identifying the company, the CEO and his pay as reported at the annual shareholder meeting, and the pay of the company’s median employee. Two companies – Comcast and Oracle – have now placed in the top 25 every year. Four companies – Discovery Communications, Regeneron Pharmaceuticals, Walt Disney, and Wynn Resorts – have each appeared the list this year for the second year in a row.
Highlight the titles in any column to sort numerically or alphabetically.
Rank | Company Name | CEO | CEO Pay | Median employee pay | Pay Ratio |
|---|---|---|---|---|---|
1 |
Fleetcor Technologies Inc | Ronald F. Clarke | $52,643,810 | $34,700 |
1517  |
2 |
Oracle Corp.* | Mark V. Hurd/Safra Catz | $81,562,244 | $89,887 |
907 |
3 |
Broadcom, Inc. | Hock Tan | $103,211,163 | NA |
NA |
4 |
Mondelez International, Inc. | Dirk Van de Put | $42,442,924 | $42,893 |
990 |
5 |
Wynn Resorts Ltd. | Stephen Wynn | $34,522,695 | $44,437 |
777 |
6 |
The Walt Disney Co.* | Robert Iger | $36,283,680 | $46,127 |
787 |
7 |
TransDigm Group, Inc.* | W. Nicholas Howley | $61,023,102 | $46,742 |
1306 |
8 |
American International Group, Inc. | Brian Duperreault | $43,086,861 | $64,186 |
671 |
9 |
Mattel, Inc. | Margaret H. Georgiadis | $31,275,289 | $6,271 |
4987 |
10 |
CSX Corp. | E. Hunter Harrison | $151,147,286 | $98,697 |
1531 |
11 |
Discovery, Inc.* | David M. Zaslav | $42,247,984 | $80,858 |
522 |
12 |
TripAdvisor, Inc. | Stephen Kaufer | $47,933,462 | $99,643 |
481 |
13 |
Fidelity National Information Services, Inc. | Gary A. Norcross | $29,141,610 | $44,556 |
654 |
14 |
Ameriprise Financial, Inc. | James Cracchiolo | $23,900,309 | $107,082 |
223 |
15 |
Ventas, Inc. | Debra A. Cafaro | $25,254,607 | $88,630 |
285 |
16 |
Halliburton Co. | Jeffrey A. Miller | $23,078,364 | $79,636 |
290 |
17 |
Expedia Group, Inc. | Mark D Okerstrom | $30,720,457 | $71,696 |
428 |
18 |
Regeneron Pharmaceuticals, Inc. | Leonard S. Schleifer | $26,508,058 | $123,418 |
215 |
19 |
Jefferies Financial Group, Inc. | Richard B. Handler | $21,787,285 | $44,584 |
489 |
20 |
IQVIA Holdings, Inc. | Ari Bousbib | $38,029,517 | $97,997 |
388 |
21 |
Comcast Corp. | Brian Roberts | $32,520,224 | $71,006 |
458 |
22 |
Allergan Plc | Brenton Saunders | $32,827,626 | $94,064 |
349 |
23 |
Schlumberger NV | Paal Kibsgaard | $20,759,340 | $88,604 |
234 |
24 |
Netflix, Inc. | Reed Hastings | $24,377,499 | $183,304 |
133 |
25 |
AT&T, Inc. | Randall Stephenson | $28,720,720 | $78,437 |
366 |

The most common reason cited to vote against pay packages is that they are not strongly connected to performance, but disclosure failures and other issues also factor heavily. Here is some specific language — collected from guidelines or disclosure on particular votes — that illustrates reasons for opposition. (Further information on sources available upon request.) All of these are explanations for why a fund may, or may already have, voted against pay packages.
Pay disconnected from performance; excessive potential pay; peer issues. Funds have policies that vote against:
CEO pay plans that have no absolute limit on the amount of some or all of various bonus payments;
CEO pay plans that have discretionary payments;
Some or all of CEO pay awards vest automatically as time passes instead requiring the meeting of some performance requirement at each vesting point;
Any performance requirement that allows vesting when performance is below the median of peers;
Any payment in the form of stock options.
Failure of adequate disclosure:
The short-term incentive program or long-term incentive program thresholds and maximums are not sufficiently disclosed;
No identifiable limit for each of the different components within the policy.
Insufficient long-term emphasis and risk mitigation practices:
Long-term incentive plans with performance cycles shorter than 3 years;
The absence of clawbacks of variable remuneration;
Insufficient holding period requirements.
As in prior years, we note that pension funds give CEO pay packages more scrutiny and a greater level of opposition than financial manager controlled funds. Also, in general, European based investment funds vote against CEO pay packages at a greater rate than U.S. based ones.
Over the past five years the number of funds that have markedly increased their level of opposition to S&P 500 CEO pay packages has grown.
The number of S&P 500 companies where large numbers of shares were voted against the CEO pay package has increased.
The companies with overpaid CEOs we identified in our first report have markedly underperformed the S&P 500.

* First date w voting avilable 2014 **First data w voting available 2015 *** First data w voting available 2016
Two years ago, we analyzed how these firms’ stock price performed since we originally identified their CEOs as overpaid. We found then that the 10 companies we identified as having the most overpaid CEOs, in aggregate, underperformed the S&P 500 index by an incredible 10.5 percentage points and actually destroyed shareholder value, with a negative 5.7 percent financial return. The trend continues to hold true as we measure performance to year-end 2018. Last year, these 10 firms again, in aggregate, dramatically underperformed the S&P 500 index, this time by an embarrassing 15.6 percentage points. In analyzing almost 4 years of returns for these 10 companies we find that they lag the S&P 500 by 14.3 percentage points, posting an overall loss in value of over 11 percent.
If one were to exclude the votes of the three biggest asset managers in the world (Blackrock, Vanguard and State Street, all of which tend to vote to approve almost every CEO pay package presented to them), it would be even more obvious that the number of positive votes is going down dramatically. Together these three funds control between 15 percent and 20 percent of the shares at almost every single public company in America, and their refusal to vote against more than just a very, very few CEO pay packages stands out. A recent paper by Harvard Law School professors Lucian Bebchuk and Scott Hirst analyzed these asset managers and found that they have strong incentives to under-invest in stewardship and defer excessively to the preferences and positions of corporate managers.5

Financial managers often rely on proxy advisors to evaluate CEO pay packages. The two largest advisors are Institutional Shareholder Services (ISS) and Glass Lewis, but there are also several smaller advisors, such as Egan Jones, Segal Marco and PIRC. In 2018 lobbyists for big business attacked these firms suggesting that fund managers were blindly following their advice.
In fact, it appears that many funds that subscribe to ISS and Glass Lewis vote to approve numerous CEO pay packages that these advisory services advise to vote against. Proxy Insight, an independent data provider tracking the voting records and policies of more than 1,700 global investors, conducted an analysis 6 of investor voting correlation with recommendations from ISS and Glass Lewis and found “a clear divergence in actual voting behavior compared to proxy advisor vote recommendations.” (Proxy Insight filed this analysis as an SEC comment letter.) Specifically, Proxy Insight analyzed the voting of the largest 20 asset managers on CEO pay packages at S&P 1500 companies during the period July 1, 2017 to June 30, 2018. The analysis showed that when ISS and Glass Lewis recommended “against” a pay package, the correlation of voting with recommendations was low.
ISS recommended voting against 11.8 percent of the CEO pay packages at S&P 500 companies, and 33 percent of the 100 most overpaid CEOs. These percentages have been fairly unchanged year after year. These numbers are based on the default ISS “standard” policy. ISS also offers some specific ESG policies. This year the ISS SRI policy recommended against approximately 14 percent of these pay packages, and a policy tailored to Taft-Hartley pension plans, recommended against 24 percent. Many users of ISS proxy voting services take advantage of ISS’s ability to create additional custom policies. In the case of CEO pay these custom policies can produce substantial differences from the standard ISS recommendations.
ISS uses a quantitative degree-of-alignment scale to evaluate pay and performance. According to FAQs issued December 2018, ISS will “continue to explore the potential for future use of Economic Value Added (EVA) measures to add additional insight into a company's financial performance” and will display those measures in reports this year.7 Glass Lewis recommended shareholders vote against 9.5 percent of CEO pay packages at S&P 500 companies, and 27 percent of the 100 most overpaid CEOs. These figures are lower than they have been in previous years.
Glass Lewis recommended shareholders vote against 9.5 percent of CEO pay packages at S&P 500 companies, and 27 percent of the 100 most overpaid CEOs. These figures are lower than they have been in previous years.
Glass Lewis, which can also create custom policies, uses a model comparing CEO pay in relation to company peers, and company performance compared to peers, and awards letter grades between A and F. An “A” means that “the company’s percentile rank for executive compensation is significantly less than its percentile rank for company performance.”8
Egan-Jones Proxy Services recommended voting against approximately 30 percent of the CEO pay packages at S&P 500 companies, and against 49 percent of the 100 most overpaid CEOs. Egan-Jones reported to us that in five cases where they did vote in favor of the CEO pay vote, they had opposed stock award or omnibus plans at the same companies.
Segal Marco Advisors, which has one of the most rigorous analyses of CEO pay packages, recommended shareholders vote against 42 percent of CEO pay packages at S&P 500 companies, and 70 percent of the 100 most overpaid CEOs. Maureen O’Brien, vice president and director of corporate governance, notes that the Segal Marco Advisors cast votes for 84 funds that subscribe directly for proxy voting and corporate governance services and additional funds that receive consulting or discretionary services. When analyzing compensation, Segal Marco does a first screen to identify corporations with good financial performance and less-than-anticipated pay. Those companies generally receive a “yes” vote. Those that don’t fit in that category receive a secondary screening on a variety of pay practices (from accelerated vesting to gross-ups).
PIRC, one of the largest proxy advisors in Europe, recommended voting against approximately 72 percent of the CEO pay packages at S&P 500 companies, and 90 percent of the 100 most overpaid CEOs.
We have analyzed how the largest investors in S&P 500 companies, namely mutual funds, ETFs, and public pension funds, have voted their shares on the issue of CEO pay. This enables us to see which funds are exercising their fiduciary responsibility and which are acquiescing to management in squandering company resources.
The mutual fund section of the report was based on data provided by Morningstar Fund Votes database. An explanation of the Unique Vote count methodology they use can be found in Appendix D.

See Appendix D for a full list as well as an explanation of the methodology used in calculating votes. Assets Under Management (AUM) are from Proxy Insight, and taken from most recent data in ADV forms filed at the SEC.
One estimate found that as of Dec. 31, 2017, BlackRock, Vanguard, and SSGA held positions of more than $1 billion in 353, 427, and 242 S&P 500 companies, respectively9. Rick Warzman recently wrote in “When it comes to investment giants furthering social good, many see a disconnect between words and action” that “the investment giants all seem to be saying the right things” but their voting does not match. Warzman quotes long-time investor advocate Tim Smith who notes that, “Confidential dialogue is vitally important, but quiet conversation combined with . . . a proxy vote sends a much clearer and less ambiguous message.”10
An important paper by Harvard’s Lucian Bebchuk and Scott Hirst, “Index Funds and the Future of Corporate Governance: Theory, Evidence, and Policy”, examines the reluctance of Blackrock, Vanguard, and State Street to vote against management. The study demonstrates “that index funds managers have strong incentives to (i) under-invest in stewardship and (ii) defer excessively to the preferences and positions of corporate managers.”11 They claim that there is no financial incentive for these managers to engage in serious stewardship. In addition, they also claim that deferring to management “could also affect the private interests of the index fund manager.” The deference can spring from a “web of financially-significant business ties” (for example, managing a firm’s 401(k) plan), or from fear of public or political backlash.
The paper concludes with a number of potential reforms, one of which – bring transparency to private engagements – SSGA has already begun.
In a separate paper, Patrick Jahnke interviewed 29 individuals from 20 institutional investors (managing a combined $13.3 trillion) for his paper “Asset Manager Stewardship and the Tension Between Fiduciary Duty and Social License.” Jahnke notes that, in the past it had been a winning strategy to remain neutral, and “kept [large fund managers] out of the limelight and away from regulatory interest, while maximizing the potential client base.” However, he believes it is “doubtful that the same strategy will work in the future, now that asset managers have grown to such a size that they have become household names.” As Jahnke notes, “In a democratic capitalist society, failure to” maintain the “social license” or perceived legitimacy may result in consumer boycotts and “ultimately in calls for stricter regulation.”12
Despite this, Figure 5 shows more funds are voting against more packages. This year there were 87 funds that voted against more than half of the 100 overpaid CEOs.
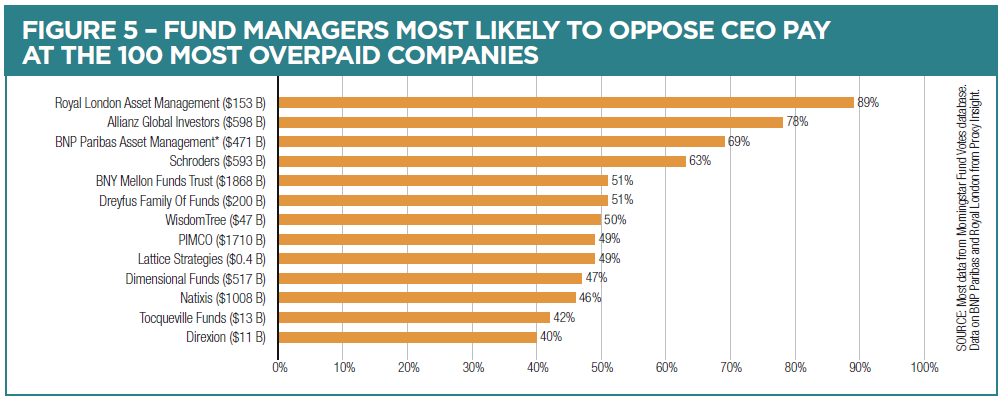
Below we include profiles of a number of fund managers. We selected those to focus on based on a number of factors including fund practices, changes in guidelines or practices, responsiveness to outreach, and whether they had been profiled in prior years.
Aberdeen Standard Investments (ASI) – AUM $786 billion
₊ View Details
Allianz Global Investors (AllianzGI) – AUM $598 billion
₊ View Details
BlackRock – AUM $6.4 trillion
₊ View Details
Pacific Investment Management Co. (PIMCO) – AUM $1.7 trillion
₊ View Details
State Street Global Advisors (SSGA) – AUM $2.7 trillion
₊ View Details
Vanguard – $4.8 trillion AUM
₊ View Details
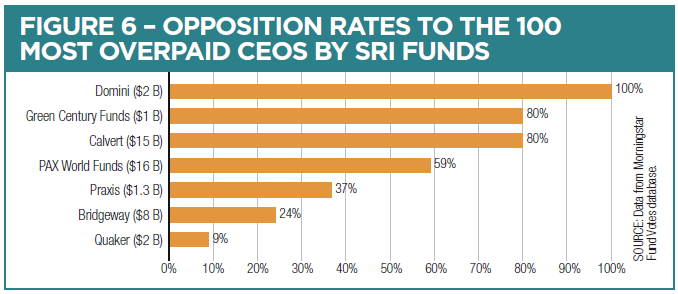
Many individuals who wish to align their investments – and the shareholder proxy voting of their investments – with their values opt to invest in socially responsible investing (SRI) funds.
As can be seen in Figure 6, some SRI funds are now more likely to vote against excessive pay packages. Notably, Green Century funds formerly had a policy to abstain from all votes on CEO compensation. In its 2018 guidelines that policy changed. The guidelines now read “Green Century will also vote in favor of ‘say on pay’ resolutions for compensation packages that are sustainable and equitable.”22 This year, that policy resulted in opposing 80 percent of the 100 most overpaid CEO pay packages.
Praxis has informed As You Sow that its policy on voting on compensation proposals is under review in preparation for the 2019 proxy season.
Trillium does not appear on the chart this year because it held fewer than 10 of the 100 most overpaid CEOs. However, it voted against pay at all of them, as well as at all of the 46 S&P 500 companies in its portfolio.
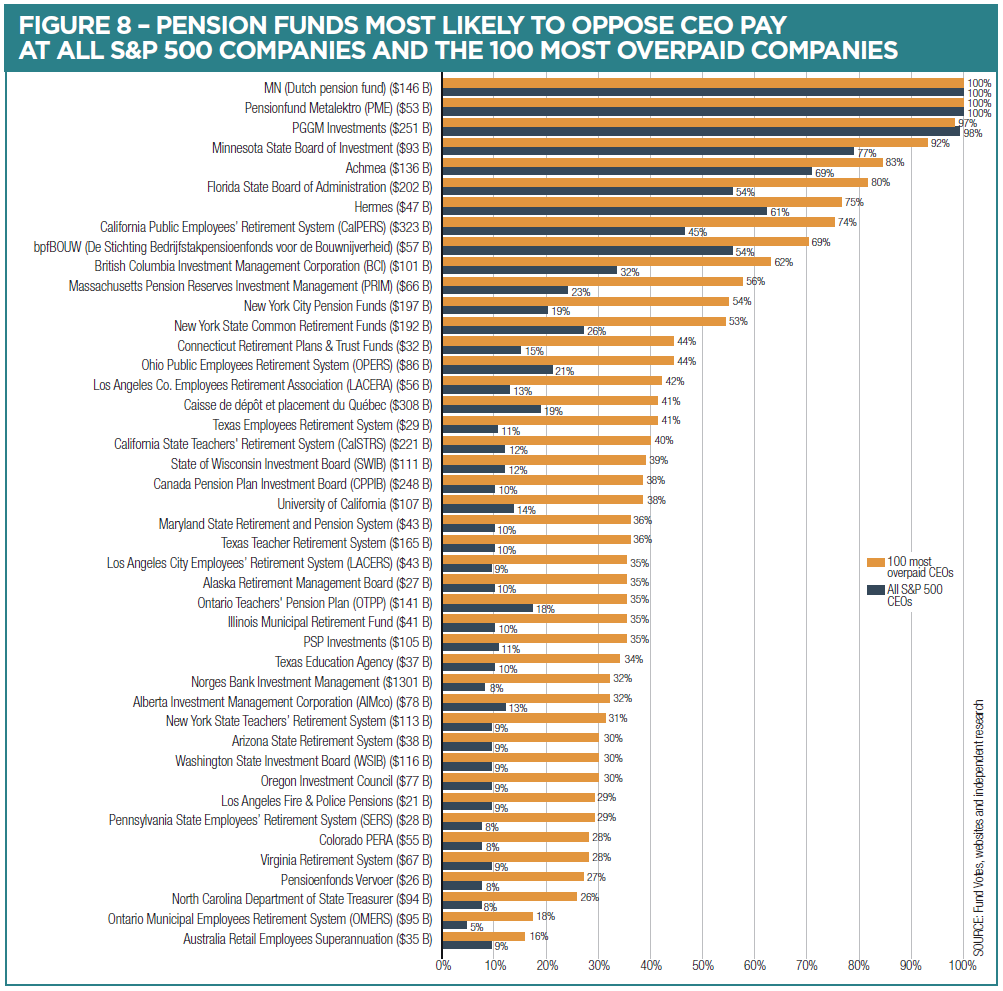
As Figure 7 illustrates, pension funds typically have a higher level of opposition to overpaid CEOs than mutual funds.

California Public Employees’ Retirement System (CalPERS) – AUM $351 billion AUM
₊ View Details
Florida State Board of Administration – AUM $203 billion
₊ View Details
Los Angeles County Employees Retirement Association (LACERA) – AUM $56 billion
₊ View Details
New York State Common Retirement Fund – $192 billion AUM
₊ View Details
Pennsylvania State Employees’ Retirement System (PSERS) – AUM $28 billion
₊ View Details
State of Rhode Island – AUM $8 billion
₊ View Details
State Board of Investments of Minnesota (SBI) – AUM $93 billion
₊ View Details
Pension funds that approve most CEO pay packages:
Employee Retirement System of Georgia (ERSG)
The trustees of the ERSG adopted has a policy to “vote and execute all voting proxies in support of management” with an exception if the Chief Investment Officer and the Co-Chief Investment Officer of the Division of Investment Services believe that “such a vote would be detrimental to the best interests or rights of the Retirement System.” According to data collected by Proxy Insight, the fund voted against only one of the overpaid CEOs: Verizon.31
Pension funds with lots of External Managers and many Comingled funds
Far more common than funds with explicit guidelines to routinely support management are funds that delegate their voting responsibilities to external managers, without providing directions on voting matters. In some cases, a fund may have just four or five managers for U.S. public equities. In other cases, it is more complex. One fund told us it had “contracts with 14 external investment advisors who managed 22 portfolios that comprised 77.3 percent of the U.S. Public Equity portfolio.”
Thus, we (and they) are unable to create assessments on how their shares are voted on the CEO pay or any other issue. As we’ve noted before, many financial fund managers are more inclined than the pension funds themselves to approve expensive CEO pay packages. While there are some managers that have significant levels of opposition, those tend not to be the ones that these pension funds use. In fact, BlackRock is by far the most common external money manager.
Examples of public funds that use external managers, often with comingled funds, include:
The State of Missouri delegates to individual investment managers the responsibility for voting proxies in the best interests of the members of the system’s members. According to the PSRS/PEERS of Missouri Comprehensive Annual Financial Report, the largest fund manager for large-cap equity is BlackRock.32
Iowa Public Employees Retirement Systems uses comingled funds at BlackRock and Mellon Capital Management, which vote quite differently. It has separate accounts at Columbia, J.P Morgan, Panagora Asset and Wellington Management. In all cases managers are allowed to vote proxies according to their own policies.
Voting for Idaho Public Employees Retirement Systems is handled externally by the following managers: Peregrine, Tukman, and MCM.
Nevada Public Employees Retirement Systems has assets with Alliance Bernstein and BlackRock, who have different voting records, and smaller percentages with two others funds.
When shareholders were evaluating compensation packages in spring 2018, they had a new piece of information: the ratio of the pay of the CEO to the pay of the corporation’s median worker. This was due to the implementation of a much-delayed provision of the Dodd-Frank Act that recently took effect.
The AFL-CIO has been tracking these ratios as they appear in company proxy statements. The average of these CEO pay to median worker pay ratios as of Sep. 5, 2018 was approximately 273:1. This contrasts sharply with around the world as reported in a BBC article. In the United Kingdom — the only other non-U.S. country besides India where CEOs make more than 200 times their employees — the ratio is estimated at 201:1. In the Netherlands the ratio is 171:1; in Switzerland it is 152:1. In Germany, where workers are represented on boards of directors, it is 136:1.33
This information can be quite illustrative of pay practices at particular companies. For example, we learned this year that the median employee at Walmart, which has appeared on our overpaid CEO list for several years, was paid $19,177, and the pay ratio of the CEO to median worker was 1,188:1.
On the other hand, Costco’s median employee was paid $38,810, and the CEO’s pay, while in the multi-millions, is much lower than at Walmart. The Costco CEO to median worker pay ratio was 191:1, one fifth of the ratio at Walmart.
While we did not include pay ratio as a criterion in identifying overpaid CEOs, we did find a predictable correlation between our list of overpaid CEOs and the pay ratio. The median pay ratio for the S&P 500 is 142:1, while the median for companies on As You Sow’s list of the 100 most overpaid CEOs is over twice as much, namely 300:1. In comparing our overpaid list to pay ratio data collected by the AFL-CIO, we found that the vast majority of the companies we identified were in the highest quartile of pay ratios.
It is not clear how funds will use this information. As Jocelyn Brown, senior investment manager at RPMI Railpen, told us, “On pay ratios, we recognize it is early days, and, like many others, we would be cautious of putting too much focus on a single number without seeing how it compares to peers and changes over time.”
Établissement de Retraite Additionnelle de la Fonction Publique (ERAFP), the asset manager for France’s public pension fund, does have a rule on pay ratios, as described in the UN PRI report: “ERAFP has set a ‘socially acceptable maximum amount of total remuneration,’ inclusive of salary, benefits, options, bonus shares, and top-up pension plan contributions, at ‘100 times the minimum salary in force in the country in which the company’s registered office is located.’”34
We expect any policies on using pay ratio as a criterion in voting on pay packages to evolve slowly over time. It is likely, however, that the newly disclosed number will soon be one of many factors shareholders consider when voting on the CEO pay package.
Pay ratio information is also being used in taxation. The city of Portland, Oregon “levies a 10 percent surtax on firms that surpass [a ratio of 100:1]. It rises to 25 percent on firms with pay gaps exceeding 250 to 1.” Similar pay gap tax bills have been introduced in California, Connecticut, Illinois, Massachusetts, Minnesota, and Rhode Island. On the federal level Representative Mark DeSaulnier (D-CA), has proposed similar legislation.35
Addressing the Council of Institutional Investors meeting in fall 2018, Carol Bowie, who for years led the compensation analysis team at ISS, said, “The key to moderating and controlling CEO pay is investors. They are really the only solution.”
She’s right.
In the five years As You Sow has been publishing this report, our research has increasingly demonstrated that all investors, from managers of the largest asset funds to the individuals contributing to a public pension or a 401(k) plan, can play a critical role in the effort to reverse the practices that have allowed CEO compensation packages to rise unabated — often without any nexus to corporate performance.
As we’ve noted in this report, the UN PRI and other studies have shown why shareholder engagement matters. “Voting against excessive pay proposals offers a tool that investors can use to intervene when proposed compensation appears to be out of line with their interests or with a sense of appropriateness.”36
In this report we’ve showcased how investors have taken a stance to moderate the excesses of CEO pay, highlighting corporate behaviors that have most frequently triggered votes against irresponsible compensation packages. Fund managers have a fiduciary obligation to consider these practices when deciding whether to support specific compensation packages. By connecting questionable corporate tactics and “no” votes on CEO compensation, this report can serve as a roadmap for institutional investors to consider revisiting their guidelines to, as PRI puts it, “reframe how CEO compensation is incentivized.”37
But the right — and responsibility — to be a watchdog does not rest with the funds alone. All shareholders can and must hold their funds accountable to ensure that corporations they entrust with their money are acting as proper stewards of their investments.
Every investor has a role to play. Union leaders should speak to their fund trustees. Teachers should contact funds such as TIAA/Nuveen; state and local government employees should reach out to their employers and their pension funds. Individual investors concerned about votes can offer feedback to their money managers; they may also choose to move their retirement accounts to social investment funds (and, in the process, let prior funds know they’re doing so, and why).
We concluded our 2018 study by urging shareholders to have their voices heard. We’re pleased to say that this advice is beginning to take hold — progress is evident in this 2019 report. But there is a long way to go.
Highlight the titles in any column to sort numerically or alphabetically.
Rank | Company | CEO | Pay | Excess | Votes to Approve CEO Pay | CEO:Worker Pay Ratio |
|---|---|---|---|---|---|---|
1 |
Fleetcor Technologies Inc | Ronald F. Clarke | 52,643,810 |
38,159,825 |
14% |
1517 |
2 |
Oracle Corp. | Mark V. Hurd/Safra Catz | 81,562,244 |
67,900,531 |
49% |
907 |
3 |
Broadcom, Inc. | Hock Tan | 103,211,163 |
86,868,639 |
62% |
NA |
4 |
Mondelez International, Inc. | Dirk Van de Put | 42,442,924 |
28,757,373 |
45% |
990 |
5 |
Wynn Resorts Ltd. | Stephen Wynn | 34,522,695 |
20,906,213 |
20% |
777 |
6 |
The Walt Disney Co. | Robert Iger | 36,283,680 |
22,408,282 |
46% |
787 |
7 |
TransDigm Group, Inc. | W. Nicholas Howley | 61,023,102 |
46,040,922 |
64% |
1306 |
8 |
American International Group, Inc. | Brian Duperreault | 43,086,861 |
29,693,425 |
62% |
671 |
9 |
Mattel, Inc. | Margaret H. Georgiadis | 31,275,289 |
19,264,188 |
46% |
4987 |
10 |
CSX Corp. | E. Hunter Harrison | 151,147,286 |
136,387,791 |
78% |
1531 |
11 |
Discovery, Inc. | David M. Zaslav | 42,247,984 |
29,692,839 |
69% |
NA |
12 |
TripAdvisor, Inc. | Stephen Kaufer | 47,933,462 |
35,018,668 |
75% |
481 |
13 |
Fidelity National Information Services, Inc. | Gary A. Norcross | 29,141,610 |
14,606,759 |
56% |
654 |
14 |
Ameriprise Financial, Inc. | James Cracchiolo | 23,900,309 |
9,879,197 |
25% |
223 |
15 |
Ventas, Inc. | Debra A. Cafaro | 25,254,607 |
11,969,664 |
59% |
285 |
16 |
Halliburton Co. | Jeffrey A. Miller | 23,078,364 |
9,828,762 |
43% |
290 |
17 |
Expedia Group, Inc. | Mark D Okerstrom | 30,720,457 |
16,588,563 |
79% |
428 |
18 |
Regeneron Pharmaceuticals, Inc. | Leonard S. Schleifer | 26,508,058 |
12,855,143 |
67% |
215 |
19 |
Jefferies Financial Group, Inc. | Richard B. Handler | 21,787,285 |
8,862,271 |
51% |
489 |
20 |
IQVIA Holdings, Inc. | Ari Bousbib | 38,029,517 |
23,710,232 |
88% |
388 |
21 |
Comcast Corp. | Brian Roberts | 32,520,224 |
18,700,417 |
87% |
458 |
22 |
Allergan Plc | Brenton Saunders | 32,827,626 |
19,362,274 |
91% |
349 |
23 |
Schlumberger NV | Paal Kibsgaard | 20,759,340 |
7,653,135 |
66% |
234 |
24 |
Netflix, Inc. | Reed Hastings | 24,377,499 |
6,717,787 |
61% |
133 |
25 |
AT&T, Inc. | Randall Stephenson | 28,720,720 |
15,455,913 |
90% |
366 |
26 |
BlackRock, Inc. | Laurence D. Fink | 27,743,233 |
13,534,946 |
89% |
195 |
27 |
Ralph Lauren Corp. | Patrice Louvet | 23,792,036 |
11,075,567 |
88% |
1038 |
28 |
Omnicom Group, Inc. | John D. Wren | 23,959,325 |
10,454,317 |
87% |
596 |
29 |
Thermo Fisher Scientific, Inc. | Marc N. Casper | 22,275,176 |
7,849,780 |
77% |
324 |
30 |
General Dynamics Corp. | Phebe Novakovic | 21,501,429 |
6,989,333 |
68% |
218 |
31 |
Centene Corp. | Michael F. Neidorff | 25,259,468 |
9,720,247 |
88% |
379 |
32 |
Duke Energy Corp. | Lynn Good | 21,415,936 |
7,842,750 |
82% |
175 |
33 |
Johnson & Johnson | Alex Gorsky | 29,802,564 |
16,064,973 |
92% |
452 |
34 |
PepsiCo, Inc. | Indra Nooyi | 31,082,648 |
17,426,678 |
92% |
650 |
35 |
Booking Holdings, Inc. | Glenn D. Fogel | 27,774,458 |
13,381,993 |
91% |
599 |
36 |
McKesson Corp. | John H. Hammergren | 18,143,017 |
4,845,682 |
27% |
473 |
37 |
Raytheon Co. | Thomas A. Kennedy | 24,883,871 |
9,998,351 |
90% |
172 |
38 |
The Goldman Sachs Group, Inc. | Lloyd Blankfein | 21,995,266 |
8,317,965 |
88% |
163 |
39 |
Twenty-First Century Fox, Inc. | James Murdoch | 20,315,944 |
6,402,830 |
78% |
300 |
40 |
Western Digital Corp. | Stephen Milligan | 17,907,624 |
4,381,912 |
42% |
1628 |
41 |
Walmart, Inc. | C. Douglas McMillon | 22,791,276 |
9,372,617 |
91% |
1188 |
42 |
Lennar Corp. | Stuart Miller | 19,127,533 |
5,499,861 |
77% |
NA |
43 |
Valero Energy Corp. | Joseph W. Gorder | 22,532,260 |
7,417,930 |
87% |
117 |
44 |
Pfizer Inc. | Ian Read | 27,913,775 |
14,246,994 |
93% |
313 |
45 |
Activision Blizzard, Inc. | Robert A. Kotick | 28,698,375 |
12,835,277 |
92% |
306 |
46 |
American Express Co. | Kenneth Chenault | 18,611,373 |
5,084,279 |
70% |
327 |
47 |
Humana, Inc. | Bruce Broussard | 19,768,523 |
4,686,890 |
66% |
344 |
48 |
Freeport-McMoRan, Inc. | Richard Adkerson | 18,396,037 |
5,864,506 |
87% |
277 |
49 |
SL Green Realty Corp. | Marc Holliday | 17,407,821 |
4,008,284 |
61% |
303 |
50 |
Abbott Laboratories | Miles White | 18,971,019 |
4,949,219 |
79% |
251 |
51 |
International Business Machines Corp. | Virginia Rometty | 18,595,350 |
5,764,002 |
89% |
341 |
52 |
Exxon Mobil Corp. | Darren Woods | 17,466,133 |
4,318,642 |
73% |
108 |
53 |
JPMorgan Chase & Co. | James Dimon | 28,313,787 |
14,064,814 |
93% |
364 |
54 |
PayPal Holdings, Inc. | Daniel H. Schulman | 19,218,634 |
5,355,127 |
88% |
274 |
55 |
Chevron Corp. | John S. Watson | 24,781,568 |
11,372,830 |
93% |
180 |
56 |
ConocoPhillips | Ryan M. Lance | 21,848,930 |
8,378,848 |
93% |
137 |
57 |
Aetna, Inc. | Mark T. Bertolini | 18,750,816 |
3,989,782 |
85% |
235 |
58 |
DXC Technology Co. | J. Michael Lawrie | 18,683,970 |
2,629,413 |
58% |
806 |
59 |
Marathon Petroleum Corp. | Gary Heminger | 19,670,807 |
5,420,391 |
92% |
935 |
60 |
Lockheed Martin Corp. | Marillyn Hewson | 22,866,843 |
8,049,435 |
94% |
186 |
61 |
3M Co. | Inge Thulin | 20,494,285 |
6,405,120 |
93% |
324 |
62 |
Verizon Communications, Inc. | Lowell McAdam | 17,937,581 |
4,579,605 |
92% |
142 |
63 |
Phillips 66 | Greg Garland | 23,650,896 |
9,441,198 |
94% |
138 |
64 |
McDonald's Corp. | Stephen J. Easterbrook | 21,761,052 |
7,826,965 |
94% |
3101 |
65 |
Newell Brands, Inc. | Michael B. Polk | 15,257,808 |
2,101,098 |
76% |
NA |
66 |
Capital One Financial Corp. | Richard Fairbank | 16,175,770 |
2,452,196 |
85% |
261 |
67 |
Prologis, Inc. | Hamid R. Moghadam | 19,352,127 |
5,247,307 |
93% |
204 |
68 |
The TJX Cos., Inc. | Ernie Herrman | 16,880,171 |
2,792,788 |
90% |
1501 |
69 |
Apache Corp. | John J. Christmann | 14,433,373 |
2,052,074 |
79% |
99 |
70 |
CenturyLink, Inc. | Glen F. Post III | 14,715,560 |
1,990,675 |
79% |
212 |
71 |
Express Scripts Holding Co. | Timothy Wentworth | 15,895,415 |
2,543,661 |
89% |
303 |
72 |
L3 Technologies, Inc. | Michael T. Strianese | 19,712,866 |
5,303,410 |
94% |
250 |
73 |
Alexion Pharmaceuticals, Inc. | Ludwig N. Hantson | 15,310,067 |
1,851,411 |
79% |
92 |
74 |
Procter & Gamble Co. | David S. Taylor | 17,354,256 |
4,075,547 |
93% |
287 |
75 |
Corning, Inc. | Wendell Weeks | 16,868,575 |
2,674,376 |
90% |
356 |
76 |
Intel Corp. | Brian M. Krzanich | 21,544,700 |
7,193,973 |
94% |
211 |
77 |
Incyte Corp. | Herve Hoppenot | 16,087,031 |
1,328,719 |
72% |
64 |
78 |
Motorola Solutions, Inc. | Gregory Q. Brown | 15,339,548 |
1,092,756 |
69% |
148 |
79 |
eBay, Inc. | Devin N. Wenig | 17,670,591 |
3,892,818 |
93% |
144 |
80 |
Invesco Ltd. | Martin Flanagan | 13,805,195 |
796,159 |
62% |
141 |
81 |
Wells Fargo & Co. | Timothy Sloan | 17,564,014 |
3,898,497 |
93% |
NA |
82 |
Nektar Therapeutics Inc | Howard Robin | 18,097,411 |
2,754,274 |
92% |
91 |
83 |
Bank of America Corp. | Brian Moynihan | 21,779,832 |
7,474,034 |
95% |
250 |
84 |
HCA Healthcare, Inc. | R. Milton Johnson | 17,268,724 |
2,615,147 |
91% |
312 |
85 |
Prudential Financial, Inc. | John Strangfeld | 27,111,399 |
13,509,684 |
96% |
268 |
86 |
The Allstate Corp. | Thomas J. Wilson | 18,757,329 |
4,631,671 |
94% |
230 |
87 |
Eversource Energy | James J. Judge | 15,915,461 |
2,153,505 |
90% |
127 |
88 |
Ingersoll-Rand Plc | Michael W. Lamach | 18,797,876 |
4,567,501 |
94% |
335 |
89 |
The Travelers Cos., Inc. | Alan D. Schnitzer | 15,233,759 |
1,410,586 |
85% |
154 |
90 |
Roper Technologies, Inc. | Brian D. Jellison | 29,158,675 |
14,878,308 |
96% |
353 |
91 |
Cummins, Inc. | N. Thomas Linebarger | 16,387,661 |
2,870,823 |
93% |
275 |
92 |
International Paper Co. | Mark S. Sutton | 19,446,293 |
5,912,629 |
95% |
230 |
93 |
Adobe Systems, Inc. | Shantanu Narayen | 21,934,033 |
6,146,315 |
95% |
NA |
94 |
AbbVie, Inc. | Richard Gonzalez | 22,625,243 |
8,090,876 |
95% |
144 |
95 |
Gilead Sciences, Inc. | John F. Milligan | 15,438,459 |
1,824,751 |
89% |
94 |
96 |
Cigna Corp. | David Cordani | 17,595,792 |
3,274,520 |
93% |
279 |
97 |
Honeywell International, Inc. | Darius Adamczyk | 16,500,153 |
2,419,282 |
93% |
328 |
98 |
Electronic Arts, Inc. | Andrew Wilson | 35,728,764 |
19,673,861 |
97% |
371 |
99 |
Anadarko Petroleum Corp. | R. A. Walker | 16,959,896 |
4,079,365 |
94% |
106 |
100 |
Tiffany & Co. | Alessandro Bogliolo | 13,976,418 |
-78,585 |
72% |
436 |
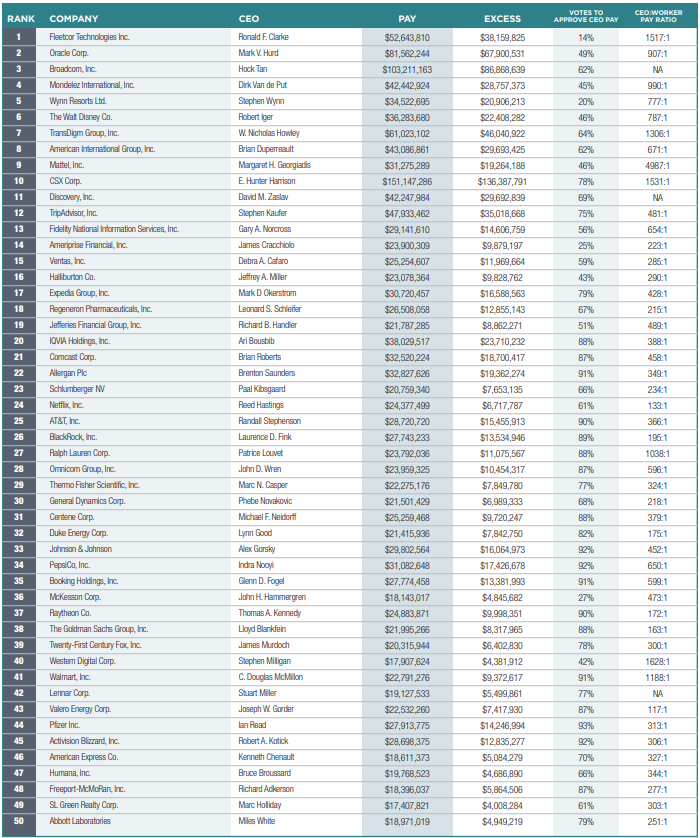
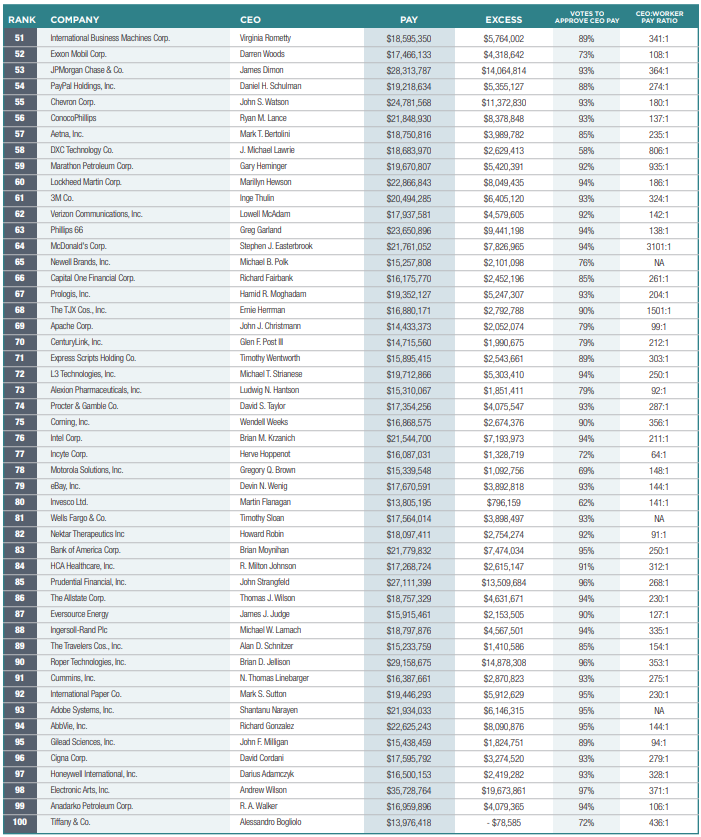
NOTE: Due to timing of the SEC rule implementation, some of the companies on the above list were not required to include pay ratio data in the proxy statement covered by this report. If so, we have used pay ratio data that has since been released. These companies are marked with an *. Also, for the purposes of this report, we considered the disclosed pay of the highest paid CEO if there was a CEO change during the year covered.
This table shows the 100 companies where the most shareholder votes were cast against the CEO pay package. Vote data from Morningstar Fund Votes database; Compensation data from ISS. These are ranked by level of opposition. The votes are not binding.
Highlight the titles in any column to sort numerically or alphabetically.


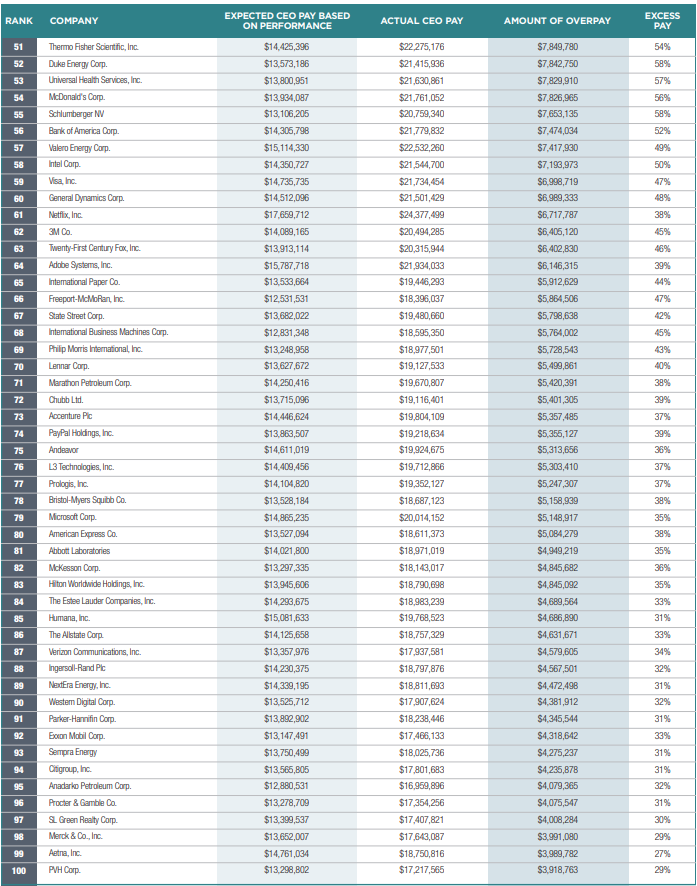
This table lists Overpaid CEOs, as calculated by the HIP Investor regression analysis, seeking to link CEO pay amount to company financial performance.
Although we, like many other analysts, find very weak links between pay amounts and company financial performance, the usual justification for high executive pay is that they are connected to enhanced profits and above-average capital appreciation for the shareholders who foot the bill. If we grant the assumption that pay should be determined by performance, and then use a basic statistical technique to map actual performance outcomes to predicted levels of pay relative to those outcomes, we can then see how much the CEO pay package exceeded such a prediction. Those with highest excess are ranked in the table below – and constitute this list of Overpaid CEOs of the S&P 500.
Executive pay data series included:
Raw data: Simply looking at every ISS-identified executive's pay package, in each year, as a single data point value – including pay, bonus, stock grants and stock options – to be paired with financial performance for that year.
The series is supplemented using a Thomson Reuters Asset4 data set that captures the single largest pay package for each (company, year) pair. If ISS did not report a CEO for a given pair, and that pair was available in the Asset4 series, the Asset4 data were included. Where ISS identifies multiple co-CEOs who split the job (like Oracle), their pay packages are added together. Once the full set of pay packages is assembled, each (company, year) value is paired with the performance for that year, and this full set is used for the regression.
Each type of executive pay could be reported in any year analyzed from 2007-2018, though not every company was reported for every year.
Financial performance series included:
Return on invested capital (ROIC — cash flow available to pay both debt and equity capital owners, adjusted for tax effects, divided by the total value of that capital). ROIC is sourced from Thomson Reuters WorldScope, which sources data from companies’ annual reports and investor filings.
Total return (capital gains and dividends) on the company’s primary equity. This is calculated from the Thomson Reuters DataStream Return Index series, using trailing periods behind Jun. 30 of the year of the pay package as identified by ISS (or matching the year for the supplementary largest package data from Asset4). Both performance factors were calculated across one-year, three-year, and five-year windows, trailing behind each possible pay year. Thus, data was considered as far back as 2002 (for the five-year window trailing pay data from 2007).
Highlight the titles in any column to sort numerically or alphabetically.

This table summarizes more than 100 financial fund managers on their CEO pay votes at all S&P 500 companies and the 100 companies with the most overpaid CEOs.
In order not to overweight votes on securities held in many separate funds managed by a particular manager, each vote is recorded only once across that manager’s many funds. The “effective unique vote” with respect to a specific CEO pay vote is the vote cast by at least 75 percent of funds across the entire family of funds in a fund manager’s portfolio. In most instances, all funds across the portfolio will vote identically. The 75 percent threshold is applied in cases where one or more funds within the portfolio vote differently. Morningstar Fund Votes database’ Jackie Cook believes that the effective unique vote count method provides the most accurate method of analyzing a fund group’s position.
Where the 75 percent consensus threshold is not met, a “Mixed Vote” is assigned and not counted as contributing to that fund’s overall level of support for CEO pay packages included in the survey.
Highlight the titles in any column to sort numerically or alphabetically.
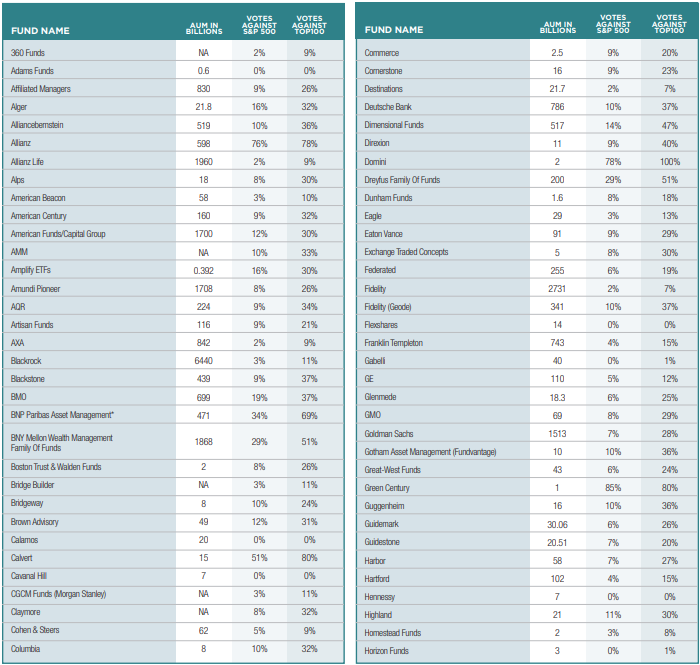

Data provided by Proxy Insight.
Highlight the titles in any column to sort numerically or alphabetically.


By HIP Investor (Onindo Khan, Erik Nielsen and R. Paul Herman)
FIGURE 1: OVERPAID CEOS UNDERPERFORM FINANCIALLY
Total Shareholder Return (TSR), annualized 3 years and 3.84 years
(Before: Feb. 28, 2012 to Feb. 28, 2015; After: Feb. 28, 2015 to Dec. 31, 2018)

The S&P 500 companies continue to boost CEO pay, the average CEO now gets almost 300 times the median worker’s pay, and the average Overpaid CEOs get 460 times the average worker pay – and the most overpaid CEO collects more than 3,000 times the median worker pay.
While defenders of high CEO pay contend that the rewards are for increased shareholder value, the truth is clear: shareholders of companies with most overpaid CEOs typically underperform the stock market.
The first edition of As You Sow’s Most Overpaid CEOs report, published in 2015, identified the 100 firms significantly overpaying their chief executives. Advocates of high CEO pay contend that pay was high at these companies as a reward for high shareholder returns. However, as seen in Figure 1, the average annual total shareholder returns in the three years prior (Feb. 28, 2012 to Feb. 28, 2015) to a high pay package was essentially the same as it was at companies without the same levels of excess pay. Then, in the nearly four years since (Feb. 28, 2015 to Dec. 31, 2018), the group of companies with the most overpaid CEOs underperformed the S&P500. If savvy investors sold, shorted, or underweighted the 100 most overpaid firms, they would have earned more than the stock market average.
When we look at the quantitative evidence, pay for performance is a myth.embarrassingly negative -15.6%. – and this even in one of the longest bull markets in history.
FIGURE 2: MOST QUARTILES ANDDECILE OF OVERPAID CEOS LAG THE MARKET

Total Shareholder Return (TSR), annualized 3 years and 3.84 years
(Before: Feb. 28, 2012 to Feb. 28, 2015; After: Feb. 28, 2015 to Dec. 31, 2018)
Our HIP Investor team analyzed multiple financial indicators over different timeframes for all S&P 500 companies and consistently found extremely low correlations (single digit correlation coefficients) between CEO pay and historical financial performance — whether one-, three- or five-year performance for financial ratios including Return on Invested Capital (ROIC), and Total Shareholder Return (TSR) including capital gains and reinvested dividends.
Unbundling the most overpaid 100 into the worst decile of 10 firms, the remainder of the worst quartile, and the remaining three quartiles, all segments underperformed the S&P 500 market average. Again, this year, the worst 10 firms with massively overpaid CEOs destroyed shareholder value, losing money for investors — and dramatically lagging the market by an embarrassingly negative — 14 percentage points.
The year 2018 has brought a massive change. Sustainable businesses are under attack by the current administration, tax breaks and favoritism have warped the relation between shareholder returns and actual future risk, and the market experienced a sharp downturn in late 2018 — the biggest since the 2008 global financial crisis.
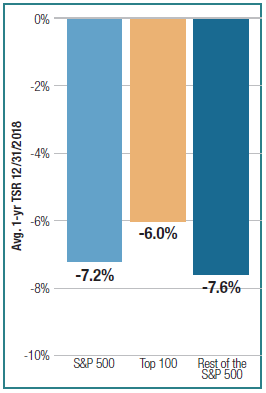
FIGURE 3: 2015 OVERPAID CEOS POSTING BIGGER LOSS IN 2018

1-Year Total shareholder Return (TSR)
from Dec. 31, 2017 to Dec. 31, 2018 of the 2015 Overpaid CEOs list
Still the 2015 Top 100 consistently underperformed this year. This overpaid group lost a full -11.3%, underperforming the S&P 500 by -3.6 percentage points. (Chart to left.)
However, we noticed that the more recent lists, especially the 2018 list, do not follow this trend. We actually see that the 2018 Top 100 outperformed the S&P 500 by 1.2 percentage points, still posting a big loss at 6%. This Trump-driven turnabout could be witnessed throughout the financial markets. Oil and Gas firms resurged, and tax cuts benefitted most large corporations. (Chart below.)
FIGURE 4: 2018 OVERPAID CEOS SLIGHTLY OUTPERFORM
1-Year Total shareholder Return (TSR)
from Dec. 31, 2017 to Dec. 31, 2018 of the 2018 Overpaid CEOs list
The trend we are observing here is only visible over the short one-year period. With a changing political landscape and transformation in fund voting behavior, as investors, we should heed the recommendations for reasonable CEO pay in our investment decisions: Long-term incentives that reduce future risk and enhance future value, while also cultivating future talent, yield firms which are more sustainable and can achieve long-term financial growth and resilience.
Your portfolio is your money. The companies and funds you invest in should be listening to you. However, the most overpaid CEO pay packages are approved by boards, elected by you the investor, and the mutual funds who hold their stocks. We encourage you as investors to speak up, vote your “say-on-pay,” and pressure the companies and funds in your portfolio with this evidence — which can benefit your long-term financial performance and a more appropriate level of rewards for results achieved.
- "Companies Shift CEO Pay Mix Following Multiple Say on Pay Failures” Equilar, 4 Feb. 2019.
https://www.equilar.com/blogs/411-ceo-compensation-and-say-on-pay.html.
- Mishel, Lawrence and Schieder, Jessica. CEO compensation surged in 2017. Washington.: Economic Policy Institute. 2018. Web.
https://www.epi.org/publication/ceo-compensation-surged-in-2017/.
- Burckart, William; Clark, Mackenzie; Lydenberg, Steve, and Musuraca, Michael. Why and how investors can respond to income inequality. London: United Nations Principles for Responsible Investment. 2018. Web.
https://www.unpri.org/download?ac=5599, 6.
- Kaissar, Nir. “CEO Pay is an Underrated Risk to Stocks.” Bloomberg 1 Feb. 2019. Web.
- Bebchuk, Lucian A. and Hirst, Scott. “Index Funds and the Future of Corporate Governance: Theory, Evidence, and Policy.” ECGI – Law Working Paper. 433 (2018): 3. SSRN. Web.
https://ssrn.com/abstract=3282794.
- Proxy Insight. “Letter to Brent J. Fields, Re: File Number 4-725 Submission in advance of Staff Roundtable on the Proxy Process.” Sec.gov/comments. Securities and Exchange Commission, 13 Nov. 2018. Web.
https://www.sec.gov/comments/4-725/4725-4636546-176444.pdf.
- Institutional Shareholder Services. “U.S. Compensation Policies Frequently Asked Questions.” Issgovernance.com. Institutional Shareholder Services, 20 Dec. 2018. Web.
https://www.issgovernance.com/file/policy/latest/americas/US-Compensation-Policies-FAQ.pdf.
- Glass Lewis. “Glass Lewis Guidelines: An Overview of the Glass Lewis Approach to Proxy Advice.” Glasslewis.com. Glass Lewis, 2019. Web.
http://www.glasslewis.com/wp-content/uploads/2018/10/2019_GUIDELINES_UnitedStates.pdf (p. 35)
- Bebchuk & Hirst. “Index Funds,” 15.
- Wartzman, Rick. “When it comes to investment giants furthering social good, many see a disconnect between words and action.” Fast Company 30 Jan. 2019. Web.
https://www.fastcompany.com/90298578/when-it-comes-to-investment-giants-furthering-social-good-many-see-a-disconnect-between-words-andaction.
- Bebchuk & Hirst. “Index Funds,” 3.
- Jahnke, Patrick. “Asset Manager Stewardship and the Tension Between Fiduciary Duty and Social License.” (2019): 4. SSRN. Web.
https://ssrn.com/abstract=3307172 or http://dx.doi.org/10.2139/ssrn.3307172.
- Gilshan, Deborah. Global ESG Investments, Quarter 3, 2018 – Report of Activities. Aberdeen: Aberdeen Standard Investments. 2018. Web.
https://www.aberdeenstandard.com/docs?editionId=d6554a67-91be-4125-b1d3-515ca5db0ab2 (Royal Mail p. 24).
- All votes reported cover the time period from Jul. 1, 2017 to Jun. 30, 2018. The percentages are calculated based on the equities voted within the S&P 500 and the list of 100 Overpaid CEOs. Those funds that voted on fewer than 25 of these companies are generally not included in this study.
- AllianzGI. “Global Corporate Governance Guidelines.” allianzgi.com. AllianzGI, May 2018. Web.
https://us.allianzgi.com/-/media/allianzgi/na/us/documents/2017/06/13/19/16/global-corporate-governance-guidelines-and-proxy-voting-policy.pdf.
- BlackRock. “BlackRock Investment Stewardship Engagement Priorities for 2018.” Blackrock.com. BlackRock, March 2018.
https://www.blackrock.com/corporate/literature/publication/blk-stewardship-2018-priorities-final.pdf.
- State Street Global Advisors. “Transparency in Pay Evaluation: Adoption of Abstain as a Vote Option on Management Compensation Resolutions.” Ssga.com. State
Street Global Advisors, April 2018. Web. https://www.ssga.com/investment-topics/environmental-social-governance/2018/05/rtl-transparency-in-payevaluation.pdf.
- Letts, Andrew. “Engaging with Rakhi Kumar of State Street Global Advisors.” Corpgov.law.harvard.edu. Harvard Law School Forum on Corporate Governance and
Regulation, 11 Sep. 2018. Web. https://corpgov.law.harvard.edu/2018/09/11/engaging-with-rakhi-kumar-of-state-street-global-advisors/.
- Stewardship 2017. Boston: State Street Global Advisors. 2017. Web.
https://www.ssga.com/investment-topics/environmental-social-governance/2018/07/annual-stewardship-report-2017.pdf (p. 2).
- Bogle, John. “Reflections on CEO Compensation.” Academy of Management Perspectives (2008): 21. Web.
http://webuser.bus.umich.edu/jpwalsh/PDFs/Bogle%20-%202008%20-%20Reflections%20on%20CEO%20compensation%20--
%20AMP%20paper.pdf.
- 2018 Investment Stewardship Annual Report. Valley Forge: Vanguard. 2018. Web.
https://about.vanguard.com/investment-stewardship/perspectives-and-commentary/2018_investment_stewardship_annual_report.pdf.
- “Green Century Capital Management Proxy Voting Policies and Procedures.” Proxyinsight.com. Green Century Capital Management, Inc., 22 Nov. 2018. Web.
https://www.proxyinsight.com/members/Investor_DOCs/Green%20Century%20Capital%20Management%20Voting%20Policy%202018%20SAI.pdf (p. 171).
- Jacobius, Arleen. “CalPERS turns focus to board diversity in proxy voting.” Pension and Investments 17 Sep. 2018. Web.
https://www.pionline.com/article/20180917/ONLINE/180919861/calpers-turns-focus-to-board-diversity-in-proxy-voting.
- Diamond, Randy. “CalPERS Rejects Pay Packages for 43% of US Companies.” Chief Investment Officer 18 Sep. 2018. Web.
https://www.ai-cio.com/news/calpers-rejects-pay-packages-43-us-companies/.
- Zdrazil, Scott. “Memorandum: Review of FY2018 Proxy Voting Results and Trends.” Lacera.com. Los Angeles County Employees Retirement Association, 10 Oct.
2018. Web. Accessed Day Month Year. https://www.lacera.com/about_lacera/boi/meetings/corp_gov/2018-10-10_corp_gov_agnd.pdf.
- Los Angeles County Employees Retirement Association. “Corporate Governance Principles.” Lacera.com. Los Angeles County Employees Retirement Association,
February 2018. Web. https://www.lacera.com/BoardResourcesWebSite/BoardOrientationPdf/policies/CorpGovPrinciples.pdf.
- “DiNapoli and NY State Pension Fund Reach Agreements with Major Companies on Executive Pay.” osc.state.ny.us. Office of New York State Comptroller, 21 Dec.
2018. Web. https://www.osc.state.ny.us/press/releases/dec18/122118.htm.
- Lally, Rosemary. “As You Sow Uncovers ISS Error.” Council of Institutional Investors Governance Alert 2 Aug. 2018. Web.
- “Shareholder Engagement and Proxy Voting.” Investments.treasury.ri.gov. State of Rhode Island, State Investment Information Center, n.d. Web.
http://investments.treasury.ri.gov/meetings-reports/proxy-voting/.
- Rhode Island Office of the General Treasurer. “Proxy Voting Guidelines.” Investments.treasurey.ri.gov. N.p, 16 Sep. 2018. Web.
https://d10k7k7mywg42z.cloudfront.net/assets/5c08053023f8124fa8129f50/Existing_Rhode_Island.pdf.
- Proxy Insight Website, https://www.proxyinsight.com/members/FMProfile.aspx?cmpid=2319 –.
- Comprehensive Annual Financial Report. Jefferson City: Public School & Education Employee Retirement Systems of Missouri. 2017.
https://www.psrs-peers.org/docs/default-source/Investments-Documents/2017-CAFR/CAFR-2017-Intro.pdf?sfvrsn=1311470d_6.
- Duarte, Fernando. “It takes a CEO days to earn your annual wage.” BBC 9 Jan. 2019. Web.
http://www.bbc.com/capital/story/20190108-how-long-it-takes-a-ceo-to-earn-more-than-you-do-in-a-year?ocid=ww.social.link.twitter.
- Burckart, Clark, Lydenberg, and Musuraca. “Why and How,” 30.
- Anderson, Sara, and Pizzigati, Sam. “When Corporations Pay CEOs Way More Than Employees, Make Them Pay!” The Nation 17 Jan. 2019. Web.
https://www.thenation.com/article/inequality-tax-poverty-billionaire/.
- Burckart, Clark, Lydenberg, and Musuraca. “Why and How,”,31.
- Burckart, Clark, Lydenberg, and Musuraca. “Why and How,”,31
Rosanna Landis Weaver, Program Manager, Power of the Proxy: Executive Compensation, As You Sow
This is the fifth The 100 Most Overpaid CEOs of the S&P 500: Are Fund Managers Asleep at the Wheel? report that Rosanna Landis Weaver has written for As You Sow. Weaver began her corporate governance career with a position in the corporate affairs office at the International Brotherhood of Teamsters in 1992, supervising research on corporate governance. In 1999 she joined the Investor Responsibility Research Center (IRRC) and served as an expert on labor shareholder activism, writing reports on compensation-related shareholder proposals and golden parachutes. At Institutional Shareholder Services (ISS), which she joined in 2005, she was a senior analyst on the executive compensation team, with a particular focus on change of control packages, and analyzed Say-on-Pay resolutions. From 2010 to 2012, she was the governance initiatives coordinator at Change to Win. Weaver holds a bachelor’s degree in English from Goshen College and a master’s in American Studies from the University of Notre Dame.
This report was made possible by the generous support of the Stephen M. Silberstein Foundation. Additional support was provided by the Arkay Foundation, the Arntz Family Foundation, the Keith Campbell Foundation for the Environment, the Firedoll Foundation, the Hanley Foundation, the Libra Foundation, the Manaaki Foundation, the New Belgium Family Foundation, the Roddenberry Family Foundation, the Roy and Patricia Disney Family Foundation, and the Singing Field Foundation.
Special thanks to:
The Proxy Insight database was invaluable and Seth Duppstadt and Sophie Miles were prompt and patient with answering specific questions. It is due to their research that we were able to vastly expand the number of funds covered in the report.
The Human Impact + Profit (HIP) Investor team conducted the regression analysis, upon which a key component of this report rests. HIP, founded in 2006, rates 121,000 investments on all aspects of sustainability (including corporate CEO pay) and how it correlates to future risk and return potential. Onindo Khan, vice president, impact analytics, and R. Paul Herman, HIP’s CEO and professor of sustainable finance at Presidio Graduate School, were extraordinarily helpful and
responsive throughout the process.
Much of the mutual fund voting analysis was based on data provided by Morningstar®, which acquired Fund Votes Research in September 2018.
Don Montuori served as an editorial consultant on this project. His fresh eyes, insight, and attention to detail were extremely valuable.
Robert Reich has been a cogent advocate for reasonable executive compensation and economic justice for decades and generously joined us as a panelist for our release webinar.
The As You Sow team; (alphabetically by last name) Andrew Behar, Sharon Cho, Jill Courtenay, Sarah Milne, and Stefanie Spear. Thanks also to the digital design team Alison Kendrick and Edward Melville, the copy editor Tami Holzman, and John Opet of Art270.
Disclaimer
The aggregated information comprising The Most Overpaid CEOs 2018 represents a snapshot in time of publicly available information regarding shareholder voting with U.S. public companies.
The information provided in The Most Overpaid CEOs 2019 is provided “AS IS” without warranty of any kind. As You Sow makes no representations and provides no warranties regarding any information or opinions provided herein, including, but not limited to, the advisability of investing in any particular company or investment fund or other vehicle. While we have obtained information believed to be objectively reliable, As You Sow or any of its employees, officers, directors, trustees, or agents, shall not be responsible or liable, directly or indirectly, for any damage or loss caused or alleged to be caused by or in connection with use of or reliance on any information contained herein, including, but not limited to, lost profits or punitive or consequential damages. Past performance is not indicative of future returns.
As You Sow does not provide investment, financial planning, legal, or tax advice. We are neither licensed nor qualified to provide any such advice. The content of our programming, publications, and presentations is provided for informational and educational purposes only and should not be considered as information sufficient upon which to base any decisions on investing, purchases, sales, trades, or any other investment transactions. We do not express an opinion on the future or expected value of any security or other interest and do not explicitly or implicitly recommend or suggest an investment strategy of any kind.
Our events, websites, and promotional materials may contain external links to other resources, and may contain comments or statements by individuals who do not represent As You Sow. As You Sow has no control over, and assumes no responsibility for the content, privacy policies, or practices of any third-party websites or services that you may access as a result of our programming. As You Sow shall not be responsible or liable, directly or indirectly, for any damage or loss caused or alleged to be caused by or in connection with use of or reliance on any such content, goods or services available on or through any such websites or services.
Copyright © 2019 As You Sow. All rights reserved.