
Carbon Clean 200™:
Investing in a Clean Energy Future
2018 Q3 Performance Update


Foreword

** As You Sow and Corporate Knights are not investment advisors, nor do we provide financial planning, legal or tax advice. Nothing in the Carbon Clean 200 Report shall constitute or be construed as an offering of financial instruments, or as investment advice or investment recommendations. Read our full disclaimer.**
We are pleased to present the 2018 Q3 Clean200™ list of publicly traded companies that are leading the way with solutions for the transition to a clean energy future.
Since our first report was launched in the summer of 2016, a great deal has changed in the world. Mainstream investors around the world have joined the march away from fossil fuels to clean energy and the big automakers are racing toward a fossil free future. In fact, the CEO of Shell announced he is going electric for his next car.
In the past 12 months, almost every major automaker announced major investments in an electric future. The head of product of the company which was previously the trivia answer to “Who killed the electric car?” announced “General Motors believes the future is all-electric,” with several other major auto companies promising to electrify (which can mean fully electric or hybrid) their entire portfolio including Volkswagen (by 2030), Toyota (by 2025), Daimler (by 2022), and Volvo (by 2019). Governments whose people are choking on polluted air are pumping this handcar of change, with China and India both announcing ambitions to phase out fossil fuel cars by 2030.
That being said, these are still turbulent times for the renewable energy sector and global markets in general. After a long period of outperforming the S&P Global 1200 Energy Index (fossil fuel benchmark), the Clean200 fell behind in June this year. The escalating trade war between the US and China targets specific Clean200 categories (including electricity transformers, lithium batteries, and LEDs) and has taken a heavy toll on Chinese stocks across the board, with the Shanghai Stock Exchange Composite Index plunging 18% year-to-date. Additionally, as the solar industry matures and is now cost competitive with coal and gas power, the Chinese government moved this June to slash solar subsidies and quotas leading to major drops in solar industry stock prices. In addition, oil prices have been steadily rising since early 2016.

Source: Bloomberg, Corporate Knights
As oil prices surged, Clean200 stocks fell behind its benchmark in June for the just the second time since inception 2 years ago.
Overall, the model we presented in the form of the Clean200 continues to indicate that demand and market forces are driving continued investment into a clean energy sector and the cost of clean technology continues to drop. The Clean200 Index is up 16.5% since its inception 2 years ago.
Controlling for the China-effect, the Clean200 ex-China continued to outperform, generating a 35.2% return over the past two years compared to its fossil fuel benchmark, the S&P 1200 Global Energy Index, which returned 23.5%. This is an unexpected result given the recent up-cycle in oil prices, and suggests that investor expectations are increasingly gathering behind a low-carbon clean energy future.
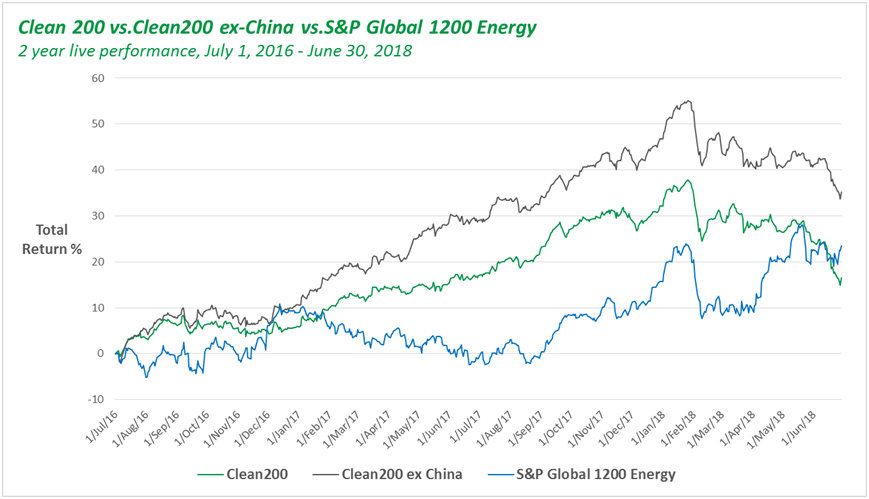
Source: Bloomberg, Corporate Knights
The Clean200, excluding China, generated a 35.2% return over the past two years compared to its fossil fuel benchmark, the S&P 1200 Global Energy Index, which returned 23.5%.
It will be very interesting to see how the trends unfold over the next few months.
| GICS Sector | # of Clean200 Companies |
|---|---|
|
Industrials |
80 |
|
Information Technology |
45 |
|
Utilities |
30 |
|
Consumer Discretionary |
17 |
|
Materials |
17 |
|
Consumer Staples |
4 |
|
Energy |
2 |
|
Financials |
2 |
|
Health Care |
2 |
|
Telecommunication Services |
1 |
CLEAN 200 Companies by Country
| Country | # of Clean200 companies |
|---|---|
|
China |
52 |
|
United States of America |
34 |
|
Japan |
19 |
|
Germany |
9 |
|
Hong Kong SAR |
8 |
|
South Korea |
7 |
|
Taiwan |
6 |
|
Canada |
5 |
|
India |
5 |
|
Spain |
5 |
|
Sweden |
5 |
|
Brazil |
4 |
|
Denmark |
4 |
|
Republic of Ireland |
4 |
|
Switzerland |
4 |
|
United Kingdom |
4 |
|
Netherlands |
3 |
|
New Zealand |
3 |
|
Finland |
2 |
|
France |
2 |
|
Philippines |
2 |
|
Thailand |
2 |
|
Australia |
1 |
|
Austria |
1 |
|
Belgium |
1 |
|
Bermuda |
1 |
|
Chile |
1 |
|
Greece |
1 |
|
Israel |
1 |
|
Italy |
1 |
|
Kuwait |
1 |
|
Mexico |
1 |
|
Turkey |
1 |
THE CLEAN 200™ Methodology
The Clean200: The biggest 200 public companies ranked by green energy revenues, was first calculated on July 1, 2016 and publicly released on August 15, 2016 by Corporate Knights and As You Sow and now updated with data through the third quarter of 2018 (June 30, 2018).
The Clean200 are listed by their estimated green revenues in USD. The dataset is developed by multiplying a company’s most recent year-end revenues by its BNEF New Energy Exposure Rating mid-point. In cases where companies disclosed their clean energy revenues, this number was verified to ensure consistency and, in some cases, used to override the BNEF data. In order to be eligible, a company must have a market capitalization greater than $1 billion (end of Q1 2018) and earn more than 10% of total revenues from New Energy sources.
The Clean200 uses negative screens. It excludes all oil and gas companies and utilities that generate less than 50% of their power from green sources, as well as the top 100 coal companies measured by reserves, top 100 weapons producers, as well as laggards on tropical deforestation, and child or forced labor and companies who engage in negative climate lobbying.
| Clean200 Negative Screens | Criteria | Number of Companies Excluded |
|---|---|---|
|
Non-Green Utilities |
Any utility that derives less than 50% revenue from green sources |
39 |
|
Tropical Forest Harm |
Scores less than 4 on Forest 500 scale or are on the As you Sow/Friends of the Earth Deforestation Free Funds Tool |
6 |
|
Oil and Gas |
SASB SICS Subsector = oil & gas |
5 |
|
Coal 100 |
Top 100 companies by coal reserves |
3 |
|
Top 100 Weapons |
The SIPRI Top 100 arms-producing and military services companies in the world |
3 |
|
Child/Forced labour |
Scores in bottom half of Know the Chain rating |
3 |
|
Negative Climate Lobbying |
Scores E or lower on Influence Map rating |
0 |
THE CLEAN 200™ List

Clean200 2018 Q3 Update: Investing in a Clean Energy Future by Toby Heaps, Michael Yow, Andrew Behar is licensed under a Creative Commons Attribution 4.0 International License.
Based on a work at https://www.asyousow.org/report/clean200-2018-q3
Did you miss the webinar?
Download the slides here.